

Great fit
Great fit
Quality of life index out of 100
Aruba
Dutch
Aruba
Aruba delivers top-shelf quality of life—below global average costs, unbeatable CPI + rent index, and endless Caribbean sun—for your expat reset.
What it's like to live in Aruba
Aruba offers a distinctive Caribbean living experience that blends Dutch administrative influences with a relaxed, multicultural island lifestyle. Located just north of Venezuela, this small Dutch Caribbean territory provides an intriguing environmen...
Your Aruba Roadmap
40+ page personal relocation analysis — visa path, tax strategy, neighbourhood guide, healthcare setup and more.
- ✓Visa & residency path
- ✓Tax optimisation
- ✓Neighbourhood guide
- ✓Healthcare & schools
- ✓Cost breakdown
Healthcare
- Aruba operates a universal public healthcare system, Algemene Ziektekosten Verzekering (AZV), which is mandatory for all legal residents and national employees.
- Expats residing in Aruba must first register with the Censo office to obtain a residence permit, then apply for AZV to access public healthcare.
- While not mandatory for entry as of early 2026, comprehensive travel insurance is highly recommended for tourists, as most foreign health insurance (including US Medicare) is not accepted, and upfront payment may be required.
Aruba is generally visa-free for short tourist visits by citizens of the United States, Canada, the United Kingdom, Australia, and most EU countries. Official and government-adjacent guidance indicates visitors can stay up to 90 days / 3 months without a visa, though some travel sources note shorter administrative limits for certain nationalities or airline rules, so travelers should confirm their exact allowance before departure . For entry, you must have a passport valid for the duration of your stay, a...
Discover Cities in Aruba
View all cities in ArubaCreate your free profile to see personalized match scores.


Travel advisories, hazards, and conflict indicators
Cost of living, housing, income, and purchasing power overview
Income tax, corporate tax, and fiscal overview
Job market, business environment, and work permits
International schools, universities, and curricula
Pension, retirement pathways, and financial planning
Seasonal temperatures, rainfall, and sunshine hours
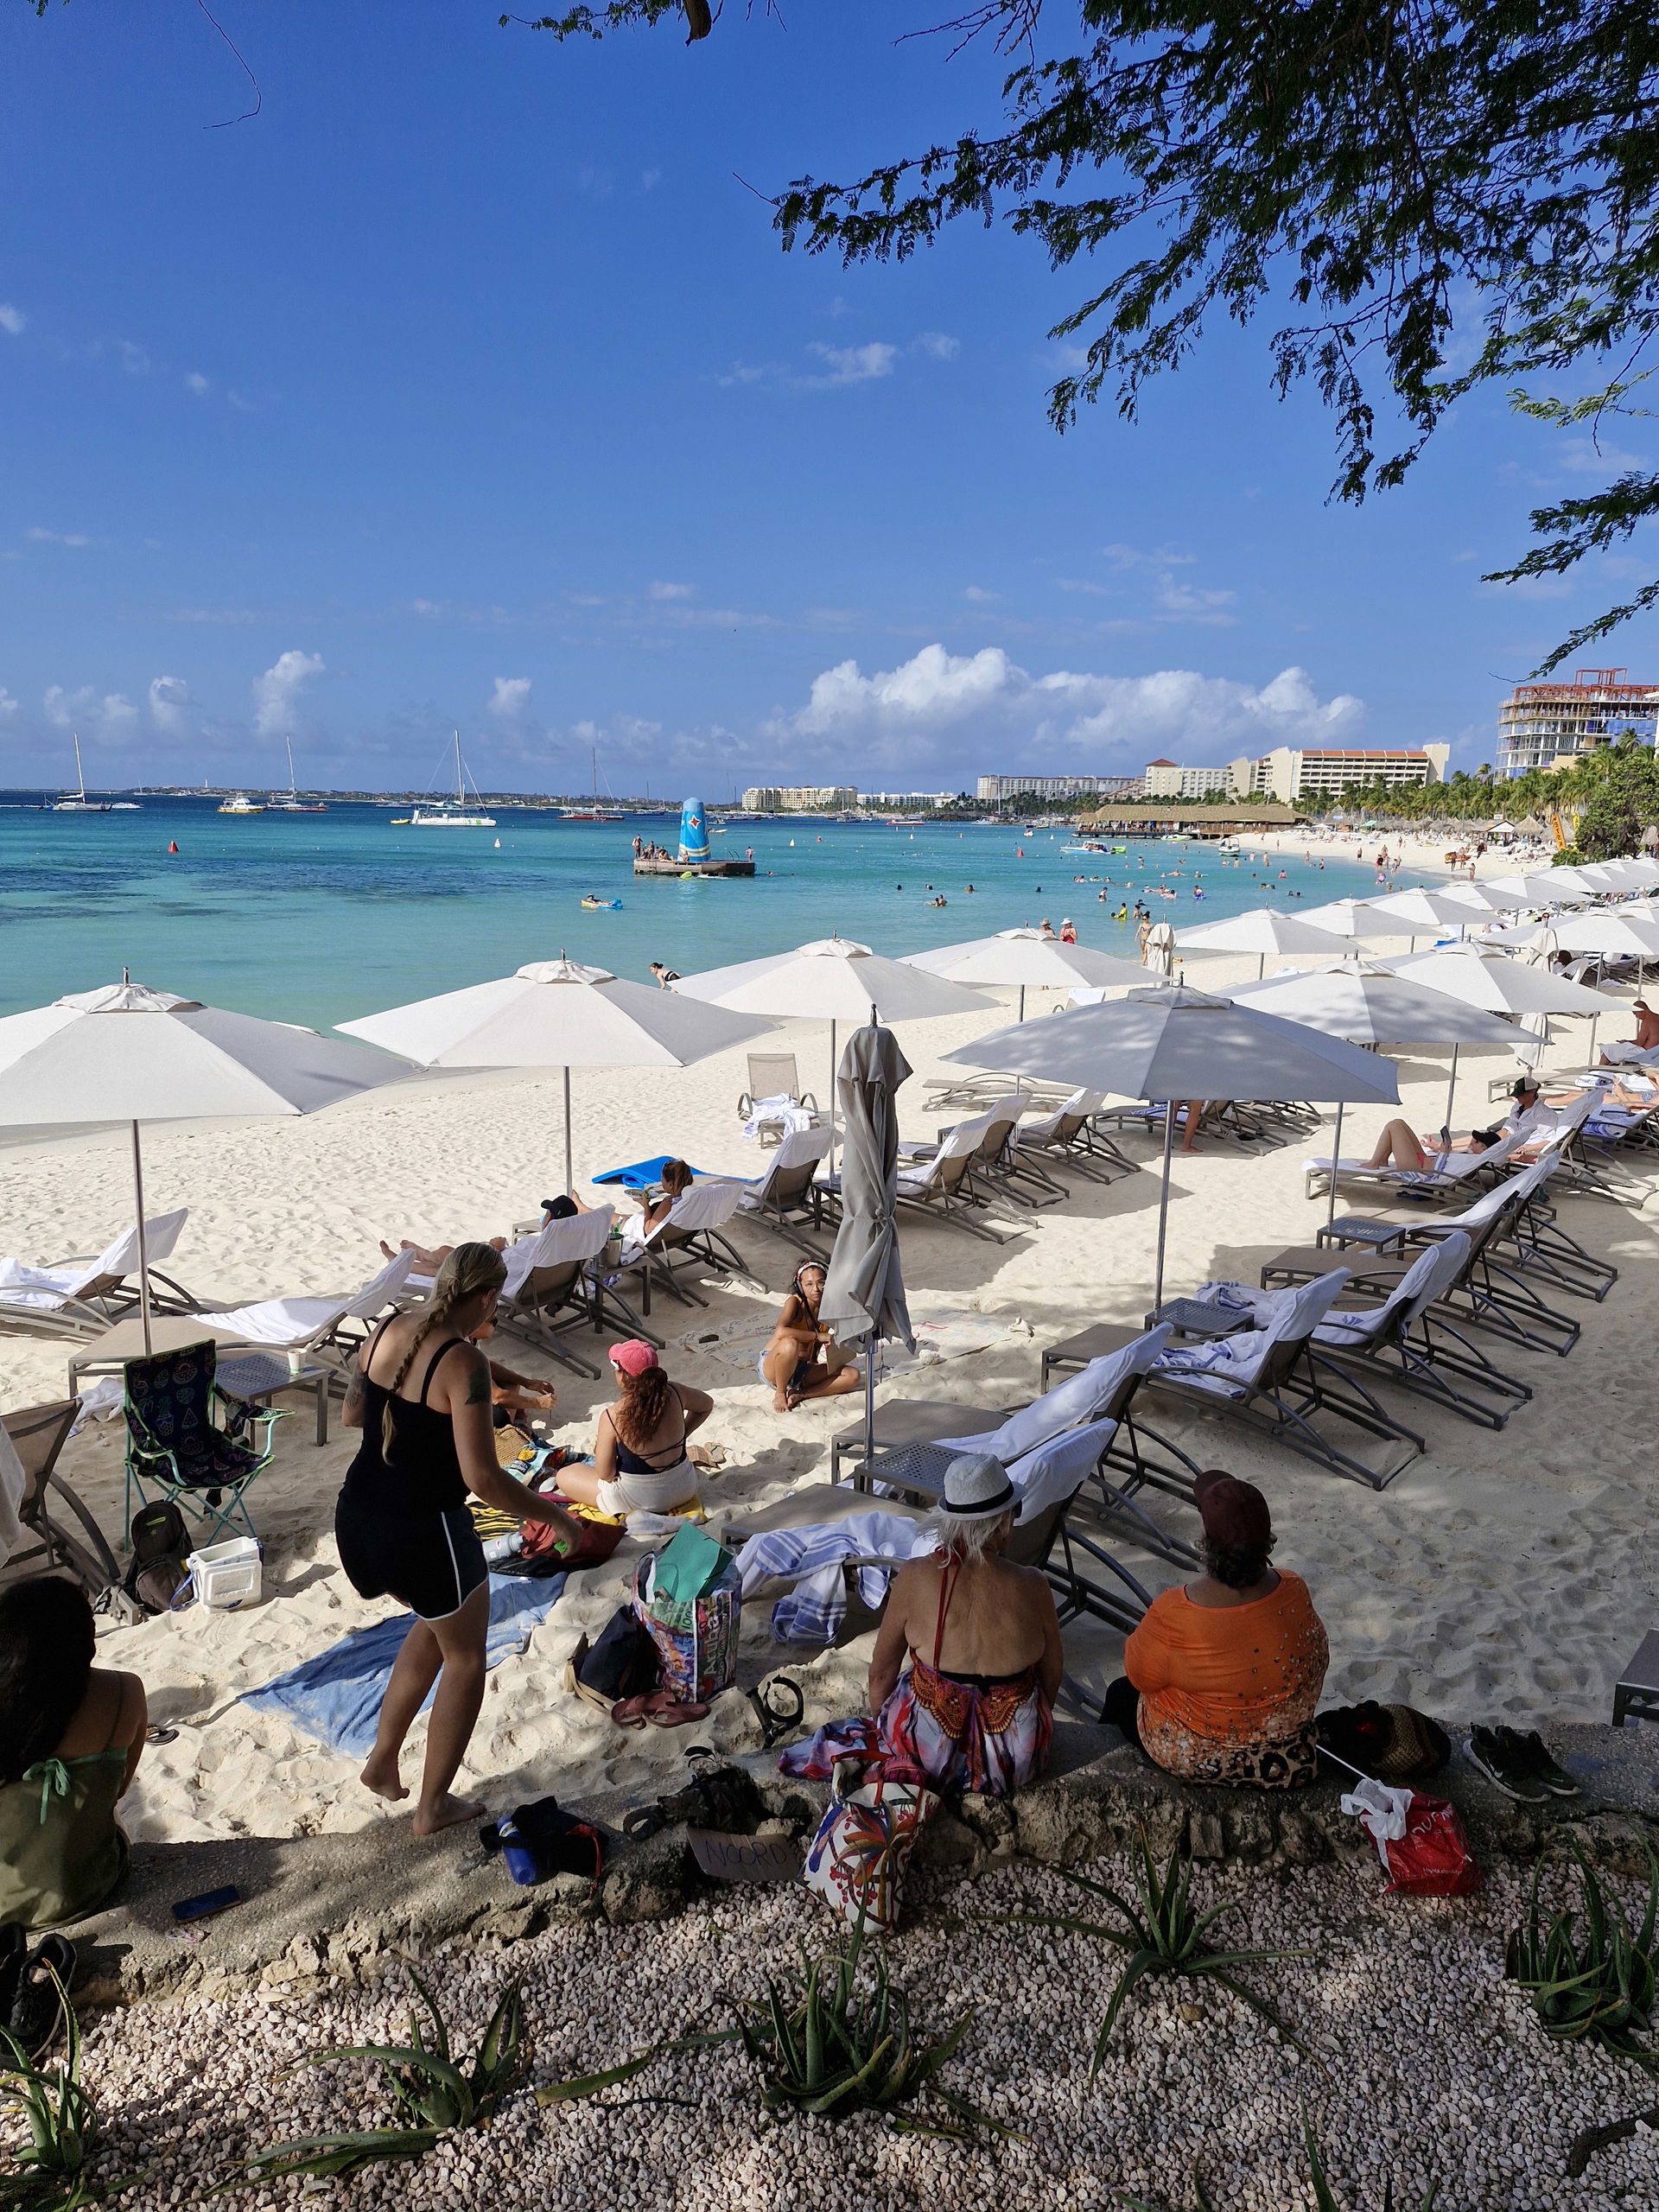
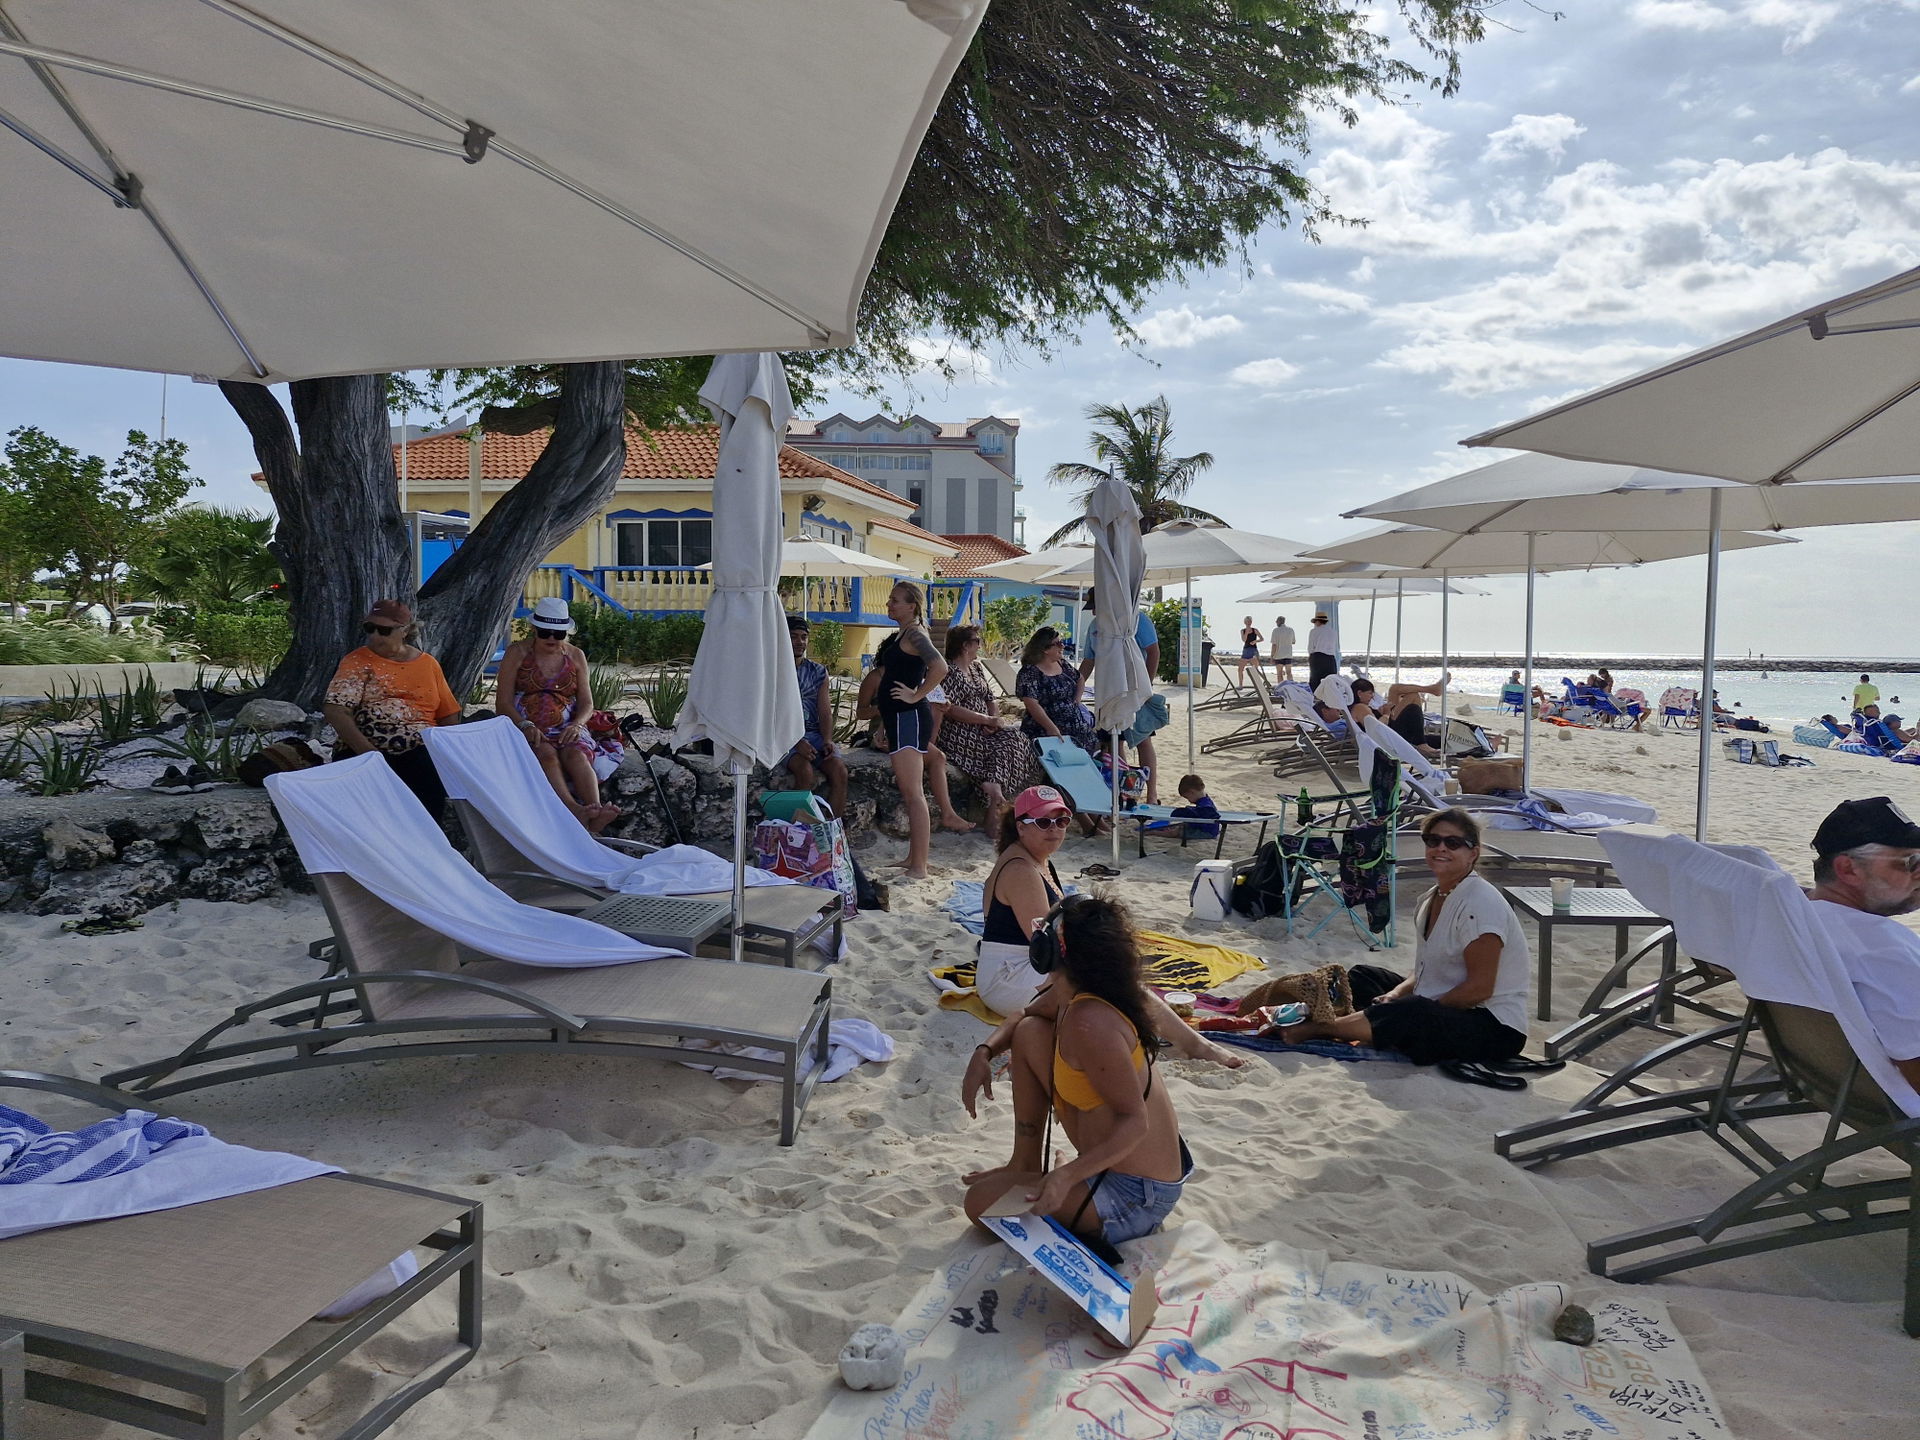
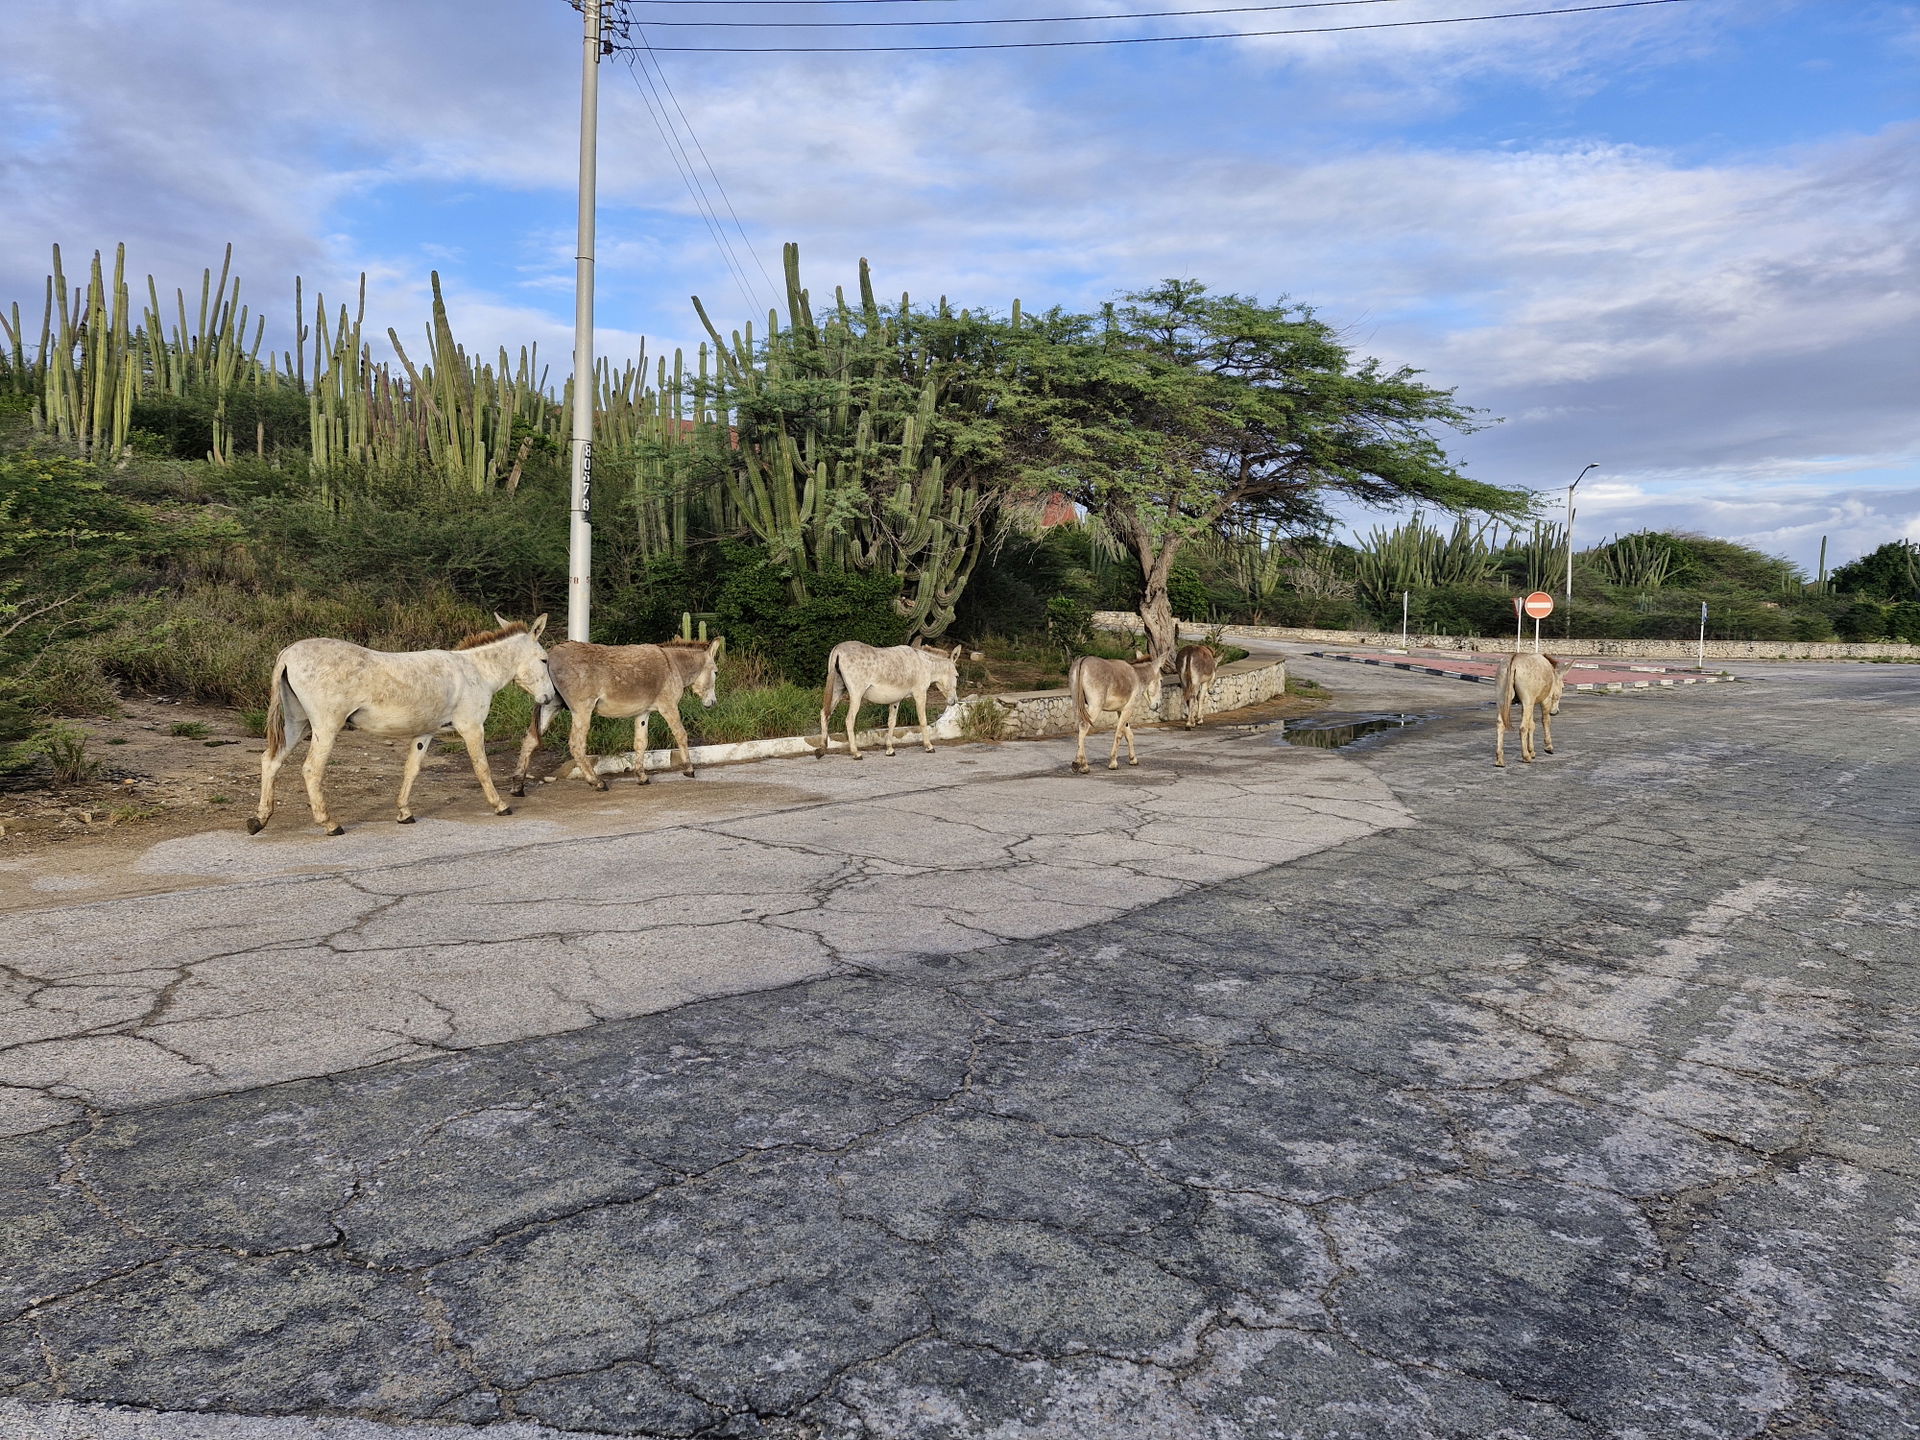
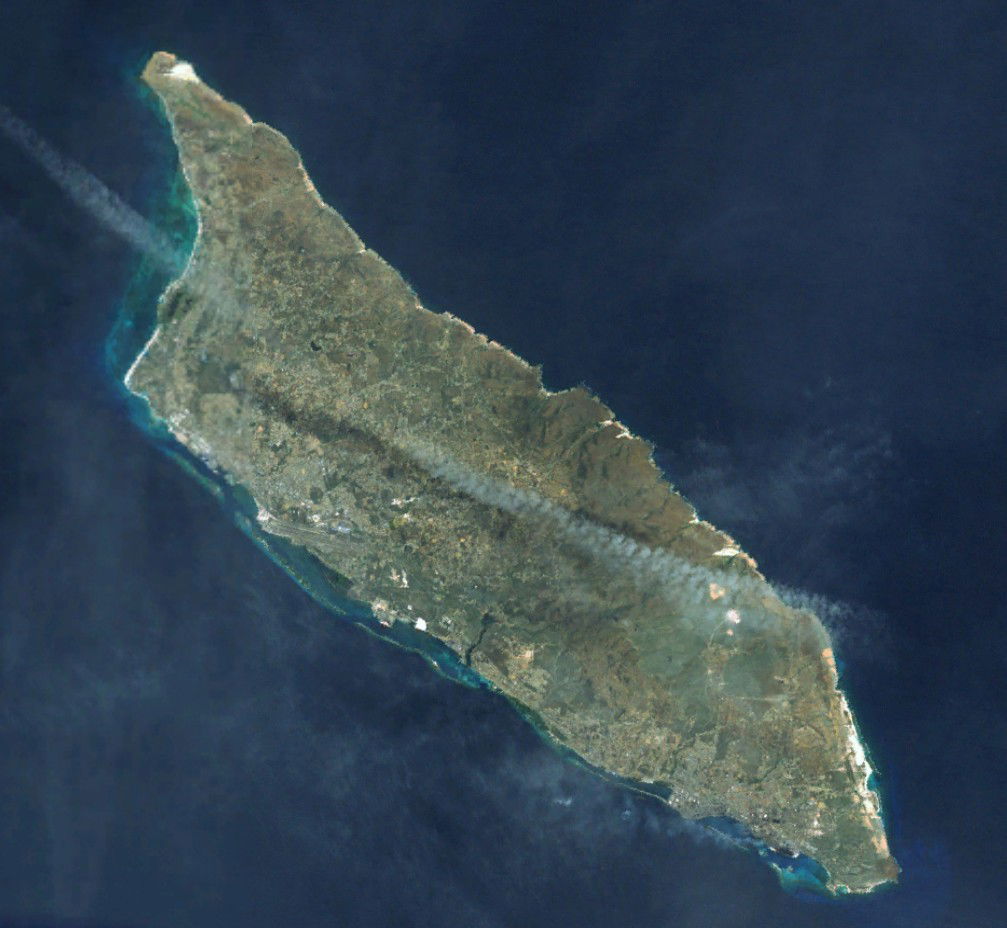
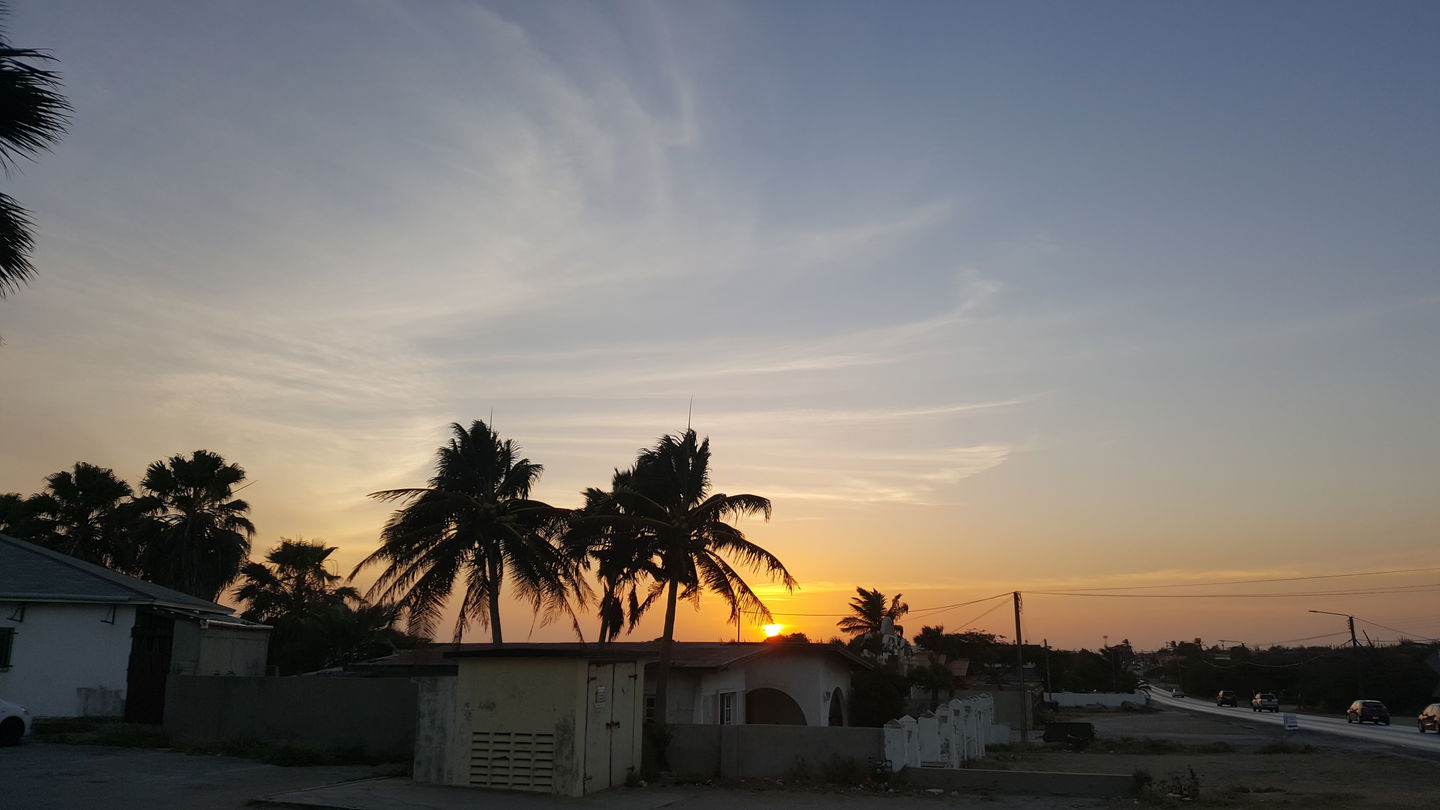
Country photos and landscapes
Population, languages, and ethnic composition
Day-to-day expat life and practical tips
Public transit, airports, and getting around
Residency, property ownership, and legal framework
Air quality, green spaces, and sustainability
Political system, government structure, and key policies
Location overview, cost of living index, and purchasing power
Economic and geographic overview at a glance
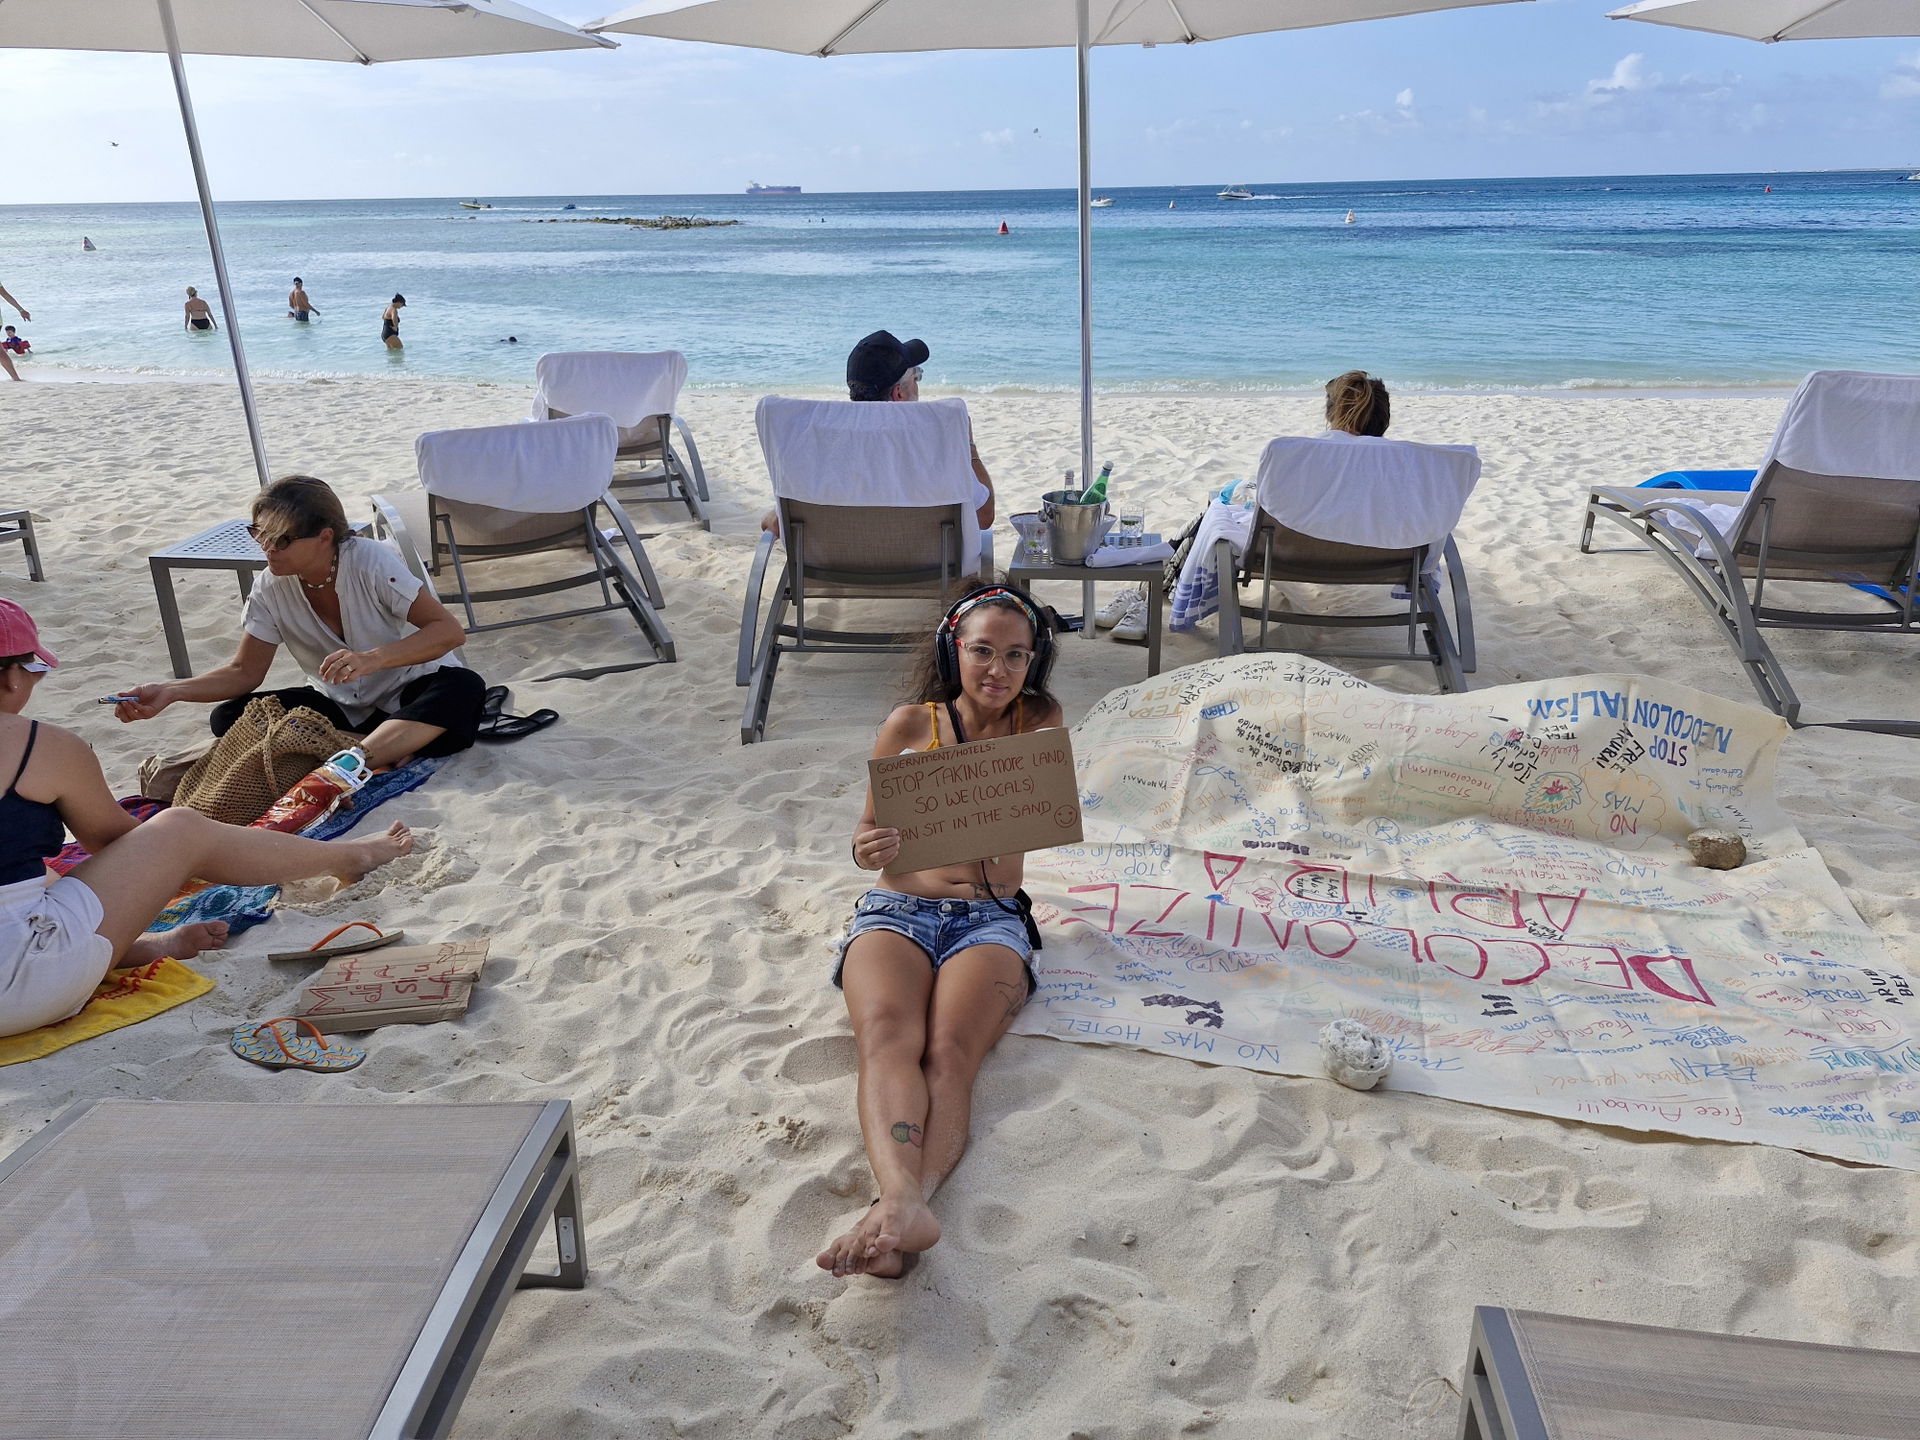
Community perspectives and expat experiences
Ready to stop
browsing and start moving?
Generate a personalized relocation roadmap — visa path, 3 shortlisted cities, tax & timeline.
This content was generated using artificial intelligence based on publicly available information. It is provided for general informational purposes only and does not constitute legal, tax, immigration, or professional advice. Information may be incomplete or outdated. Always verify with official sources before making decisions.
Data Source: Safety, crime, and quality metrics are sourced from Numbeo, a crowd-sourced global database of reported data.
All scores are relative comparisons on a 0-100 scale, where 50 = global average. Higher scores mean better than average, lower scores mean worse than average.
Community, cultural integration, and expat life